Data for business
Keen to make informed decisions? Check out our data and insights about small business in Aotearoa New Zealand.
Small business facts
Want to brush up on your small business knowledge? Check out the graphs below to get an overview of how big New Zealand’s small businesses are, what industries they are in, average wages, and more.
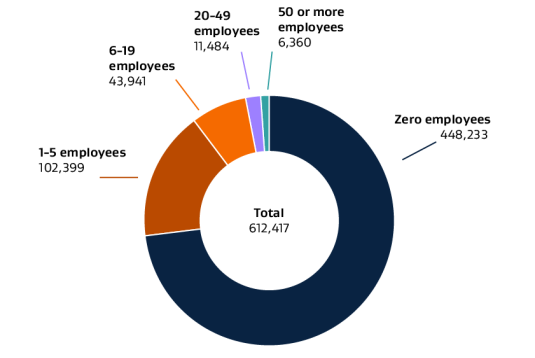
Number of businesses by employee size group
Did you know small businesses make up 97% of all businesses in Aotearoa? Of these 97%, most don’t have any employees.
Source: Business Demography Statistics, Statistics New Zealand, 2024
| Employees | Number of businesses |
|---|---|
| 0 | 448,233 |
| 1 to 5 | 102,399 |
| 6 to 19 | 43,941 |
| 20 to 49 | 11,484 |
| 50 or more | 6,360 |
| Total | 612,417 |
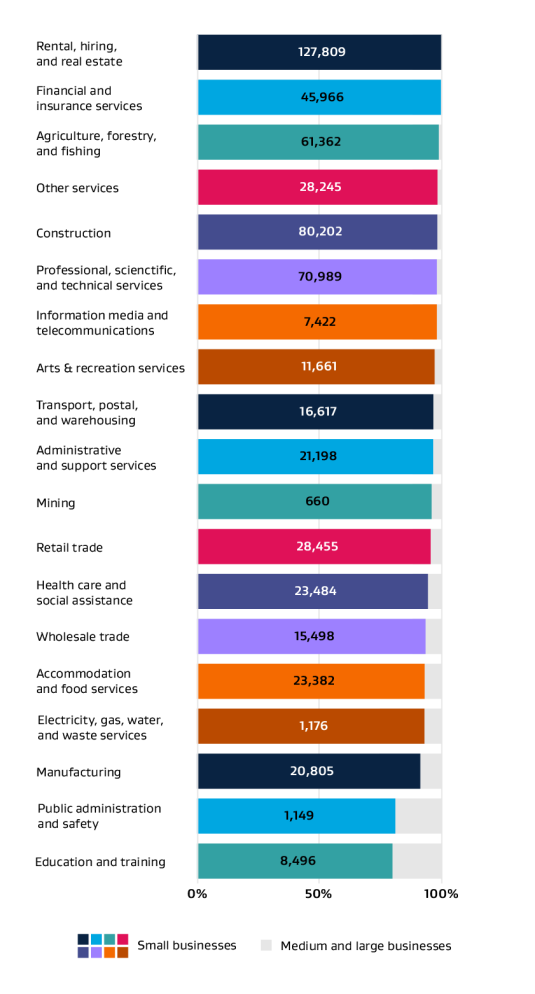
Number and percentage of small businesses by industry
Small businesses can be found in many industries. The sector with the highest proportion of small business is the rental, hiring, and real estate industry. The industry with the smallest proportion of small businesses is education and training.
Source: Business Demography Statistics, Statistics New Zealand, 2024
| Industry | Small businesses | Medium and large businesses | Total | Small business % |
|---|---|---|---|---|
| Rental, hiring, and real estate | 127,809 | 264 | 128,073 | 99.79% |
| Financial and insurance services | 45,966 | 252 | 174,291 | 99.45% |
| Agriculture, forestry, and fishing | 61,362 | 915 | 108,495 | 98.53% |
| Other services | 28,245 | 573 | 91,095 | 98.01% |
| Construction | 80,202 | 1,695 | 110,715 | 97.93% |
| Professional, scientific, and technical services | 70,989 | 1,632 | 154,518 | 97.75% |
| Information media and telecommunications | 7,422 | 171 | 80,214 | 97.75% |
| Arts and recreation services | 11,661 | 375 | 19,629 | 96.88% |
| Transport, postal, and warehousing | 16,617 | 636 | 29,289 | 96.31% |
| Administrative and support services | 21,198 | 822 | 39,273 | 96.27% |
| Mining | 660 | 30 | 22,710 | 95.65% |
| Retail trade | 28,455 | 1,434 | 30,579 | 95.20% |
| Health care and social assistance | 23,484 | 1,470 | 54,843 | 94.11% |
| Wholesale trade | 15,498 | 1,143 | 41,595 | 93.13% |
| Accommodation and food services | 23,382 | 1,824 | 41,847 | 92.76% |
| Electricity, gas, water, and waste services | 1,176 | 93 | 26,475 | 92.67% |
| Manufacturing | 20,805 | 2,055 | 24,129 | 91.01% |
| Public administration and safety | 1,149 | 273 | 24,282 | 80.80% |
| Education and training | 8,496 | 2,166 | 12,084 | 79.68% |
| Total | 594,576 | 17,823 | 612,399 | 97.09% |
Number of businesses by employee count and sales band
This table shows the number of businesses in New Zealand by the number of employees and their annual sales (grouped in bands).
Most Kiwi businesses operate with zero employees and have between $100k to $250k annual sales.
| Employee count | Sales band | Total | |||||||
|---|---|---|---|---|---|---|---|---|---|
| Zero | $0 to $50k | $50k to $100k | $100k to $250k | $250k to $500k | $500k to $750k | $750k to $1m | $1m+ | ||
| Zero | 19,935 | 95,949 | 82,002 | 97,056 | 35,544 | 10,476 | 5,235 | 13,254 | 359,451 |
| 1 to 5 | 1,209 | 5,595 | 9,093 | 28,107 | 30,972 | 16,323 | 9,492 | 22,188 | 122,979 |
| 6 to 9 | 147 | 237 | 234 | 786 | 2,880 | 3,606 | 3,069 | 12,912 | 23,871 |
| 10 to 14 | 87 | 51 | 33 | 171 | 672 | 972 | 1,317 | 9,588 | 12,891 |
| 14 to 19 | 60 | 21 | 21 | 33 | 141 | 261 | 378 | 5,673 | 6,588 |
| 20+ | 108 | 48 | 24 | 63 | 78 | 117 | 237 | 14,094 | 14,769 |
| Total | 21,546 | 101,901 | 91,407 | 126,216 | 70,287 | 31,755 | 19,728 | 77,709 | 540,552 |
Source: Annual Enterprise Survey, Statistics New Zealand, 2024
Due to rounding, individual figures may not sum to the stated total. Differences in scope between the Annual Enterprise Survey and the Business Demography Survey results in a different ‘total businesses’ figure.
Average salaries and wage per employee
The average salary/wage for small business employees has increased with inflation, staying slightly above the living wage from 2019 to 2021.

Source: Annual Enterprise Survey, Statistics New Zealand, 2021
| Year | Salary |
|---|---|
| 2019 | $51,546 |
| 2020 | $54,596 |
| 2021 | $56,964 |
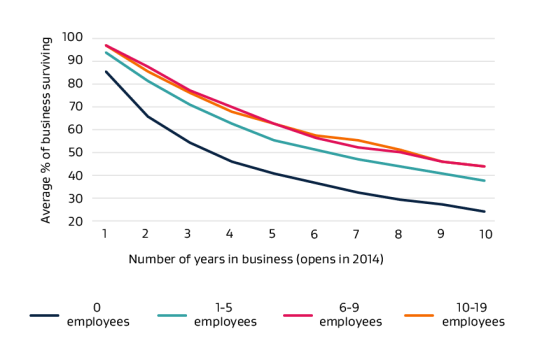
Average years in business by business size (employees)
Larger businesses (by number of employees) tend to stay in business longer than smaller businesses.
Source: Business Demography Statistics, Statistics New Zealand, 2024
| Years since opening | ||||||||||
|---|---|---|---|---|---|---|---|---|---|---|
| Business size (employees) | 1 | 2 | 3 | 4 | 5 | 6 | 7 | 8 | 9 | 10 |
| 0 employees | 84 | 65 | 54 | 46 | 41 | 37 | 33 | 30 | 28 | 25 |
| 1 to 5 employees | 92 | 80 | 70 | 62 | 55 | 51 | 47 | 44 | 41 | 38 |
| 6 to 9 employees | 95 | 86 | 76 | 69 | 62 | 56 | 52 | 50 | 46 | 44 |
| 10 to 19 employees | 95 | 84 | 75 | 67 | 62 | 57 | 55 | 51 | 46 | 44 |
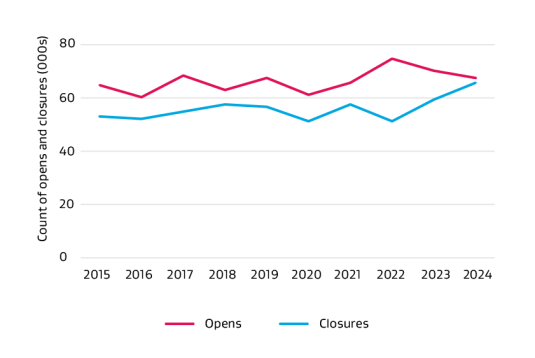
Opens and closures of employing small businesses
Recently, the number of businesses that have opened has decreased, while the amount of closures has increased.
Source: Business Demography Statistics, Statistics New Zealand, 2024
| Year | 2015 | 2016 | 2017 | 2018 | 2019 | 2020 | 2021 | 2022 | 2023 | 2024 |
|---|---|---|---|---|---|---|---|---|---|---|
| Opens (000s) | 65 | 60 | 69 | 63 | 68 | 61 | 66 | 76 | 71 | 68 |
| Closures (000s) | 52 | 51 | 54 | 57 | 56 | 50 | 57 | 50 | 59 | 66 |
Exporting insights
The value of New Zealand’s exports steadily increased in the ten years to March 2024. Our top five export destinations and export products also remained pretty stable over this time.
Imports and exports over time (Year ending March 2024)
Since 2022, the value of Aotearoa’s imports has been greater than the value of our exports.
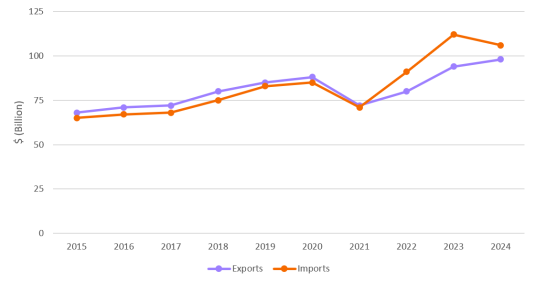
Source: Statistics New Zealand, 2024
| Year | Imports ($ Billion) | Exports ($ Billion) |
|---|---|---|
| 2015 | 65 | 68 |
| 2016 | 67 | 71 |
| 2017 | 68 | 72 |
| 2018 | 75 | 80 |
| 2019 | 83 | 85 |
| 2020 | 85 | 88 |
| 2021 | 71 | 72 |
| 2022 | 91 | 80 |
| 2023 | 112 | 94 |
| 2024 | 106 | 98 |
Top five exports by product (Year ending March 2024)
Dairy and travel top the list for Aotearoa’s largest exports.

Source: Statistics New Zealand, 2024
| Description | Value ($ Billion) |
|---|---|
| Dairy | 20 |
| Travel | 14 |
| Meat and edible offal | 9 |
| Wood | 5 |
| Transportation | 4 |
Top five export destinations (Year ending March 2024)
Most of our exports go to the People’s Republic of China, with the USA and Australia rounding out the top three spots.
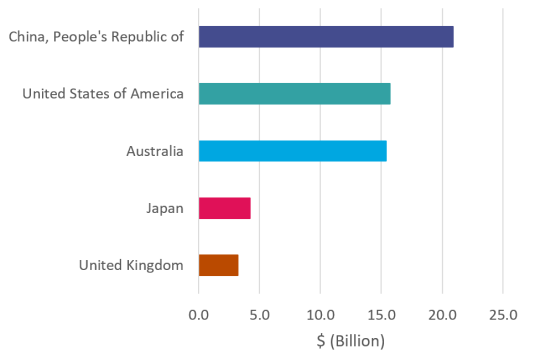
Source: Statistics New Zealand, 2024
| Country | Value ($ Billion) |
|---|---|
| China, People’s Republic of | 20.9 |
| United States of America | 15.7 |
| Australia | 15.4 |
| Japan | 4.2 |
| United Kingdom | 3.2 |
Sectors and manufacturing data
Check out the graphs below to get an overview of sectors and manufacturing in New Zealand.
Proportion of manufacturing sector by industry
Food and beverage, and machinery and equipment are our largest manufacturing industries.

Source: Ministry of Business, Innovation and Employment, 2023
| Sector | % of manufacturing |
|---|---|
| Chemical and refining | 6% |
| Plastics and rubber | 2% |
| Food and beverage | 33% |
| Metals | 10% |
| Wood and paper | 12% |
| Other manufacturing | 14% |
| Machinery and equipment | 24% |
Contribution to Gross Domestic Product (GDP) by manufacturing sector
Food and beverage, and machinery and equipment are our largest manufacturing contributors to GDP.
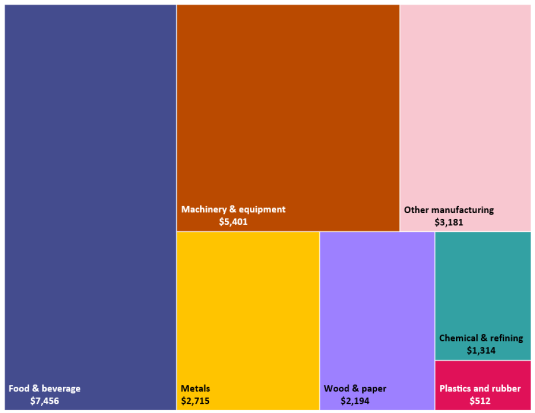
Source: Ministry of Business, Innovation and Employment, 2023
| Sector | Real Gross Domestic Product 2023 ($ Million) |
|---|---|
| Food and beverage | 7,456 |
| Machinery and equipment | 5,401 |
| Other manufacturing | 3,181 |
| Metals | 2,715 |
| Wood and paper | 2,194 |
| Chemical and refining | 1,314 |
| Plastics and rubber | 512 |